Jasper Reports
For generating reports Mapfish Print uses Jasper Reports. Jasper Reports is a mature library generating reports. From the website:
The JasperReports Library is the world's most popular open source reporting engine. It is entirely written in Java and it is able to use data coming from any kind of data source and produce pixel-perfect documents that can be viewed, printed or exported in a variety of document formats including HTML, PDF, Excel, OpenOffice and Word.
The central part of Jasper reports are the templates. A template is the layout of the report. It contains branding, styling and the definition/layout of the report data. Once a template is created, it can be compiled and ran to generate the report. In certain cases, all the required data (database connection parameters, url to images, etc...) are present in the template but it can also contain parameters that need to be set by the executor of the template. In the case of Mapfish print, the latter pattern is used. The output of the processors and attributes defined in the configuration file(config.yaml) will be passed to the jasper report template for execution. The values can be used by the template to as the parameters.
When designing the template, the trick is to know the type of object that will be passed to the template from Mapfish print. For example, the createMap processor will pass a sub-report to the template, which will need to be embedded into the template. This information should be provided in the documentation of the various processors.
In addition to needing to know how to embed the output of processors, all the other input parameters of the template must be added to the attributes section in the config.yaml
Practical guide to Jaspersoft Studio
Basics
Templates for jasper reports can be created by hand. However, you may be interested to use a pleasant
interface since we are talking about visual products.
Jaspersoft Studio is the
software we recommend to use. It has an active community and a good support. Jaspersoft Studio will help you
creating a jrxml file, which is a template layout. It is the main and sometimes only file needed for a
printed report. This file will be compiled as a .jasper file before creating the print output. Used with
Mapfish Print, the jrxml file will take the role of a "container", waiting for data to produce a nice and
useful PDF report. If you are deeply interested in the way reports Studio are created with Jaspersoft, you
can follow this
tutorial. However, the Mapfish Print pipe allow us to leave out huge parts of the report creation workflow (we can
at least skip the chapter about loading data in the report).
On the following file, you can observe the principle parts of Jaspersoft Studio:
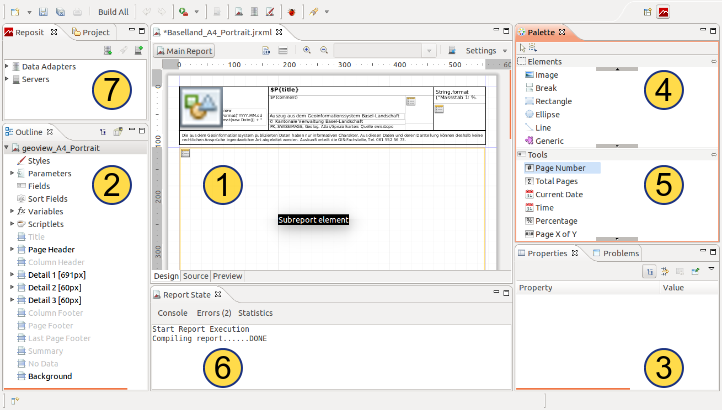
- The report template (what your are currently editing), through either a gui view or a text view (tabs at the bottom left corner)
- Outline for managing bands, parameters, variables etc.
- Property window of selected item. Appearance, content properties and advanced properties.
- Elements available for insertion in the report (do not use the map element).
- Shortcut to preconfigure fields
- Console for information and errors
- Data connection (not used with Mapfish Print)
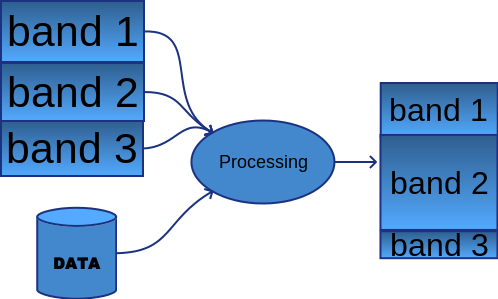
Jasper reports have a "band logic": different data will fall in different bands. The report will be structured in many bands, which have each one particular behaviors. Moreover, the data themselves affect how the bands will be printed. This is shown on the next graphic. What you see in Jaspersoft Studio is therefore not what you will get. The preview tab in the main window allows to pass through this inconvenience when working on a report template. Unfortunately, the introduction of maps by Mapfish Print doesn't allow to use directly the preview tab in Jaspersoft Studio.
Mapfish Print, jasper reports and Jaspersoft Studio
One of the most important change from version 2 to 3 of Mapfish Print, at least for users, is the use of jasper template (jrxml) as basis of layout. The chapter "General workflow for adapting existing templates" provides enough information for working with Jaspersoft Studio. The key point stands in the fact that Mapfish Print as NOT been developed for enhancing the Studio software, but the Jasper Report Library. This remark involves some sort of incompatibility with Studio, however being easily solved by small manipulations. When editing template in Jaspersoft Studio, keep in mind this last point.
Elements vs Content
An important concept is the differentiation between the containers you add to your template and all the things with which you can populate them. Containers are called "elements" in Jaspersoft Studio and are visible under the number 4 in the previous image. The main elements are static text, text field and subreport. With Mapfish Print, all special elements (maps, scale bar, etc.) are placed as subreport. Apart from maps elements, we are here mainly focused on the text fields. Text fields have dynamic text thanks to the expressions. An expression can use parameters, variables or functions (we don't discuss the fields since we are not interesting in loading data directly from database).
- Parameters : set at the compiling. They can be string, integer, boolean etc. The map elements are passed by parameters, as well as scale bar, north arrow, etc. More standard parameters can also be used with Mapfish Print, as title or comments for example
- Variables : they are calculated at the compiling. They are not given by an external source of the report, as parameters. Variables are typically page numbers or current date. They can also represent a value calculated on parameters.
- Functions : java functions, for example String.format("static text: %.0f", parameter)
The bands
The table below comes from this
website. More than description of
bands, it provides a broad and clear idea of the logic behind jasper reporting.
Take a look at the most important bands : Title, page header, detail, background.
| Title | This section appears only once at the beginning of the report. |
| Page Header | This section appears at the beginning of each page in the generated document. |
| Column Header | This section appears at the beginning of each column in the generated document. If the report has only one column defined, then column header and footer sections are ignored. |
| Group Header | This section is introduced by a report group (chapter Groups). Each time the grouping expression changes its value, the group header section is printed above the detail section. In case, if more than one group is defined, the group header is printed in the order of group definition. |
| Detail | This section is repeated for each line of data supplied by the report's data source. The detail section can be made of multiple bands. |
| Group Footer | This section is introduced by a report group (chapter Groups). The group footer section is printed below the detail section before the value of the grouping expression changes. The group footer is always printed for the last line of data in data source. In case, if more than one group is defined, the group footer is printed in the reverse order of group definition. |
| Column Footer | This section appears at the bottom of each column. If the report's column count is 1, then column header and footer sections are ignored. |
| Page Footer | This section appears at the bottom of each page. |
| Last Page Fotter | This section replaces the regular page footer on the last page of the report. In case the summary section is also present, then this might not be the very last page of the document. This section is sometimes useful when summary information has to be displayed at the bottom of the last page. |
| Summary | This section appears only once at the end of the report. |
| No Data | This section is printed when the When No Data Print report property is set to No Data Section. If the <noData> section is defined in the report template, and if the data source is empty, then the <noData> section will be the only one taken into account at fill time, and its content will produce the report output. |
| Background | The background section is displayed on every page and cannot overflow to the next page. Elements placed on this section are evaluated at page initialization time and are displayed in the background. All other page objects are displayed on top of the background objects. This section is useful for creating page watermarks. |
Parameters, Variables and Expressions
Above is a brief description of differences between parameters, variables and functions. We will see here in
more details how to fill elements of template with parameters and variables.
As described, parameters are values given by an external source of the report. In an ordinary application,
parameters are often transmitted through a web service. It is therefore complex (but possible) to add or
delete new parameters. Good news is that once you have you service running, you will not require parameters
other than those already in place, at least in most cases. New parameters can be created in the outline
window of Jaspersoft Studio by right-clicking on "Parameters". Another way is to create directly the
parameter in the source code by adding a line on the top of the document, near the other parameter
declarations. For example, declaring the new "title" parameter is done as follow :
<parameter name="title" class="java.lang.String" isForPrompting="false">
    <parameterDescription><![CDATA[Title of map]]></parameterDescription>
</parameter>
name is the name of the parameter, class is the java class (String, Integer, Float, Boolean,
etc.), isForPrompting (see further) will be ignore outside Jaspersoft Studio. Last,
parameterDescription is optional. Once again, you don't have to add more parameters and this
explanation is more for understanding parameters than for manipulation purposes.
the title parameter will be called with the following expression:
$P{title}
$P{title} would be for a parameter, $V{title} would be for a variable, $F{title} would be for a database
field.
It's already known that parameters and variables are reporting values, but are not displayed by their own on
the printed report. A container needs to be set for displaying them. For a simple text parameter, we can use
a text field container. Back to the title example :
<textField>
        <reportElement x="179" y="0" width="375" height="12"/>
        <textFieldExpression><![CDATA[$P{title}]]></textFieldExpression>
</textField>
textField is the container in which we will add content. reportElement describes where and how the field will be displayed. It's the property of the container. Contents are added to the container through an expression. It may be a good habit to use the expression editor of Jaspersoft Studio since it has useful error messages.
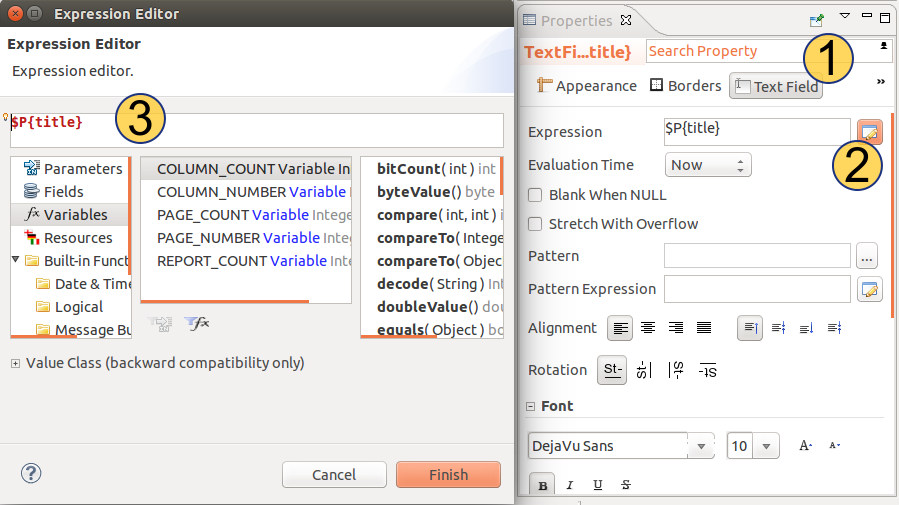
After the selection of a report element, click on 1 to open content properties and then on 2 to open the
editor. The expression editor will open for customization of the expression in 3.
All the same goes for variables usage, with the difference that a variable has its own expression (recall:
variables are not passed to the report but calculated directly at print generation time).
Appearance
Visual settings of report elements are found in the Appearance tab of the property window. The location
refers to the top left corner position of the element. ⚠ Location is given in reference to the band
beginning without the margins. Margins of the documents are set in the page format settings:
Outline -> select main document (top) -> property window -> tab "report" -> edit page format (bottom)
It's here that behavior of fields are set. For example, you can allow a text field to be multiline and to
extend if the text (passed as parameter) is very long. In this case, you will tell the rest of the
documents, below the extension, to shift down. Since such behaviors are not easy to manage, it's recommended
to set elements not stretchable and fixed relative to the top. In case you implement other behaviors, it
would be worth to extract the best of all the sections (header, details, summary, etc.) for managing many
pages.
PDF fonts
⚠ The number of fonts supported by PDF documents are limited. There is a special method of setting PDF fonts for text fields. This is done under the ui path: select element -> property window -> tab "advanced" -> tree: font -> PDF font name. It may be easier to set the PDF font directly in the source code. All the care must be taken, on the other hand, for setting a valid PDF font name. Such code can looks like the following:
<staticText>
        <reportElement x="0" y="0" width="100" height="19"/>
        <textElement textAlignment="Center">
                <font pdfFontName="Helvetica-Bold" pdfEncoding=""/>
        </textElement>
        <text><![CDATA[Printed through GeoMapFish]]></text>
</staticText>
Tips
Snapping on the grid
One of the most important tool in Jaspersoft Studio is the snapping tool. Snapping is available on elements, on rulers or on the grid. You can customize snapping behaviors by clicking on the arrow next to the "settings" button at the top right corner of the central window. Snapping on grid can be enabled or disabled, but most importantly, grid size can be adjusted there.
Jaspersoft Studio peculiarity
Jaspersoft Studio, even if it's easily accessible and usable, suffers from many drawbacks. It's important to
know about drawbacks, so lots of trouble can be avoided:
know your enemies and know yourself, you will not be imperiled in a hundred battles. Sun Tzu
I will illustrate this affirmation with some examples. The main purpose is recognition of such mechanisms
when encountered. One already known example is the font with PDF documents (see previous chapter).
Example 1: background color and transparency
In a usual software, some settings are disabled when it's senseless to give a settings. This logic does not
apply to Jaspersoft Studio. For example, you can set the color of a text field background in window property
-> appearance -> color. Just below, there is a transparent check box, which makes the background fully
transparent. If you check the box, you can still set any color but this will have no effect.
Such behavior can be observed for different tools in Jaspersoft Studio.
Example 2: page numbering
Page number can be accessed through the variable $V{PAGE_NUMBER}. In the palette window, you can observe the Page X of Y tools. The same variable (page number) is used two times, but has different values. The difference comes from the evaluation time property (property window -> text field -> evaluation time), which leads to different values of the variable. It's not a problem of the software, just a very confusing implementation of a simple page counter.
General workflow for adapting existing templates
Here is a short description of steps required for being able to create a new template from another already existing. This is particularly useful for Mapfish Print users having the willingness of customizing their template without the need of calling an IT expert.
- Install Jaspersoft Studio
- Copy the template to your local machine
-
Open the template in Jaspersoft Studio; following editions are easily done:
- Change size of report elements
- Change color, size and font of text
- Change, add or remove static texts
- Save your changes, copy the file to the server
- Update the print setup
Removing Mapfish Print dependencies
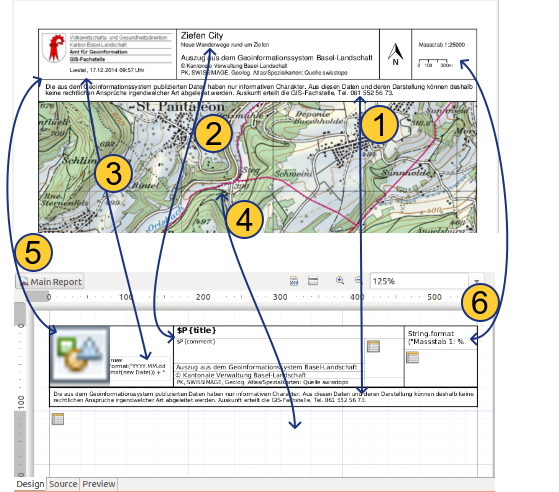
An example will be treated for illustration of almost an exhaustive dependencies list. We can see below, on the left, a print example and the print template opened in Jaspersoft Studio. Below on the right, we can see the preview result once all checks and adaptations have been applied to the template:
|
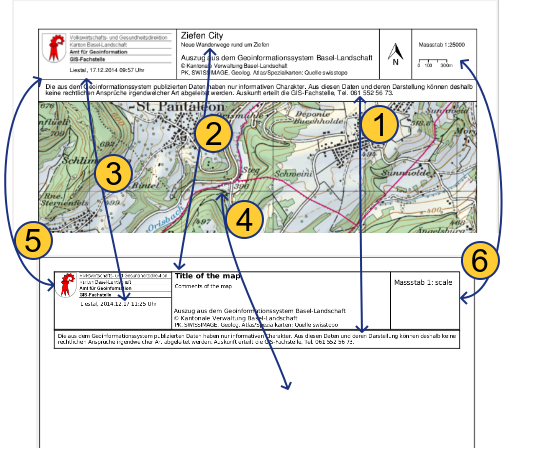
|
1: static text
With static text, it compiles easily and will often be printed as it looks like. Font difference can be observed. Information about pdf fonts can be found near the end of this documentation.
2 and 3: text field
Text fields are report elements with text that are not static. Parts of the text field element is calculating at the generation time of the printed report. Calculation of the fields is either with some functions depending on the environment (date, language, etc.) or depending on parameters passed to the print template (title, map, etc. ). When a preview is created on Jaspersoft Studio, parameters need to be set, because text fields are calculated. Parameters will be asked in Jaspersoft Studio as on the next image for generating reports.
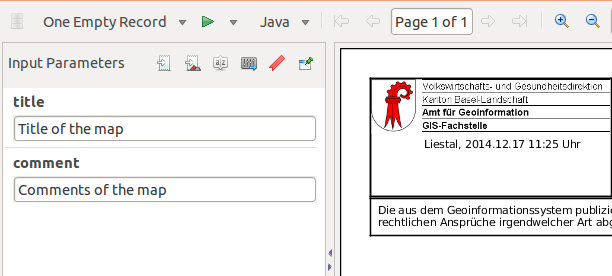
There is a parameter option which has to be true (or checked) for allowing the prompt to be used. This
option will be critical for map elements. Parameters for map elements need to be ignored, so NOT asked. If
parameters are asked in the prompt window, check the state under:
Outline window -> right-click on the parameters -> open property window -> isForPrompt -> set
Checked/Unchecked
The difference between arrow 2 and 3 is the presence of parameters in the text field. In case of arrow N°3,
no parameters will be asked and it must compiled without error without changes.
4: map
Maps are included in the report by the means of subreports. In standard jasper reports, subreports are as
named : reports inside report. With them, it's possible to access many data from different data source
inside the same report. It's also with subreport that multiple database entries will be repeated (example)
Mapfish Print uses subreport elements for including maps, but doesn't use "standard" subreport. A
requirement is therefore to disable the map subreports for being able to see the preview. In general, all
the parameters related to Mapfish Print must have false prompting behavior. You can check all the parameters
values, or directly open the source code. Near the top of the code, parameters must be declared as
isForPrompting="false":
<parameter name="mapSubReport" class="java.lang.String" isForPrompting="false"/>
This option must be set for all parameters related to Mapfish Print (but must be set by default). Here is a list of parameter which must have the setting isForPrompting as false:
- mapContext
- mapSubReport
- numberOfTableRows
- tableSubReport
- tableDataSource
- numberOfLegendRows
- legend
- scalebarSubReport
- northArrowSubReport
5: logo
The logo is usually placed on the server in the same folder as the template. For seeing the logo (and fixing the error related to it), it has to be copied from the server to the same folder as the local copy of the template.
6: others
In order to add a numeric scale you have to create a text field with the following expression:
String.format("Massstab 1: %.0f", $P{mapContext}.getRoundedScaleDenominator())
Finally add the missing mapContext parameter with the following properties:
- Name: mapContext
- Class: org.mapfish.print.attribute.map.MapfishMapContext
Preview issues
Some problems arise making the preview unusable. In our example, a problem will appear due to a special parameter related to Mapfish Print used in text field. In this case, you will have to change the text field for removing the problematic element. This manipulation have to be undo just before releasing the new template to the server. For such manipulation, open the source tab, copy the problematic part of code to a text file, keep and safe it for resetting it later. Concretely, you will do such modification for fixing this type of error:
<parameter name="mapSubReport" class="java.lang.String"
isForPrompting="false"/>
    ...
    <textFieldExpression><![CDATA[String.format("Massstab 1: %.0f", $P{mapContext}.getRoundedScaleDenominator())]]></textFieldExpression>
    ...
==>
    ...
    <textFieldExpression><![CDATA[String.format("Massstab 1: scale")]]></textFieldExpression>
    ...
Without Jaspersoft Studio
It is possible to change directly the source code on the server. It's useful for small modifications. It is also a good way to work on visual details, since it can be quickly compiled to the finished printed report.
Configuration of Mapfish Print
Once the new template is created and updated on the server, Mapfish Print needs to be told that a new template has been created and needs to know which parameters to give to it. Under the assumption that only visual modifications have been done to the template, we can enumerate the modifications to do to the file config.yaml, which is found in the same directory that the templates.
  #===========================================================================
  3 A3 portrait: !template
  #===========================================================================
    reportTemplate: Baselland_A3_Portrait.jrxml
    attributes:
      title: !string {}
      comment: !string {}
      map: !map
        maxDpi: 400
        width: 802
        height: 1033
     ...
small FAQ
What is a subreport for?
Maps are included in the report through subreports. In standard jasper reports, subreports are as named :
reports inside report. With them, it's possible to access many data different data source inside the same
report. Also, with subreports, multiple database entries will be repeated (example)
Mapfish Print uses subreport element for including maps, but doesn't use "standard" subreport.
How do I add/remove a Subreport?
You're not supposed to add a subreport in a template. You can delete subreports if, for example, you want to
remove the north arrow, scale bar, etc. You will have to do different manipulations:
- remove the subreports element in Jaspersoft Studio
- remove the linked parameter
-
remove the element in the file config.yaml for example remove the two lines :
 northArrow: !northArrow,
   size: 51
What is a variable ?
Variables are calculated at compiling using an expression each. There are not given by an external source of the report, as parameters. Variables are typically page numbers or current date. They can also represent a value calculated based on parameters.
What is a parameter ?
Parameter are objects set at the compiling. They can be string, integer, subreport etc. there are one the of of keys of Mapfish Print. The map elements are passed by parameters, as well as scale bar, north arrow, etc. More standard parameters can also be used with Mapfish Print, as title or comments for example.
How do I add/remove a Variable/Parameters?
In the Outline window, right-click on variables or parameters.
What variables are available ?
A small list of built-in variables is available in the Palette window, under tools. You can create as many variables as you wish.